DQA visualizations: Plausibility
Plausibility: Are data value believable? Do data values accurately reflect the concepts that they are supposed to represent? Do sequences of values make sense, such as no new encounters after date of death or no negative weight/height measurements.
Visualizing plausibility
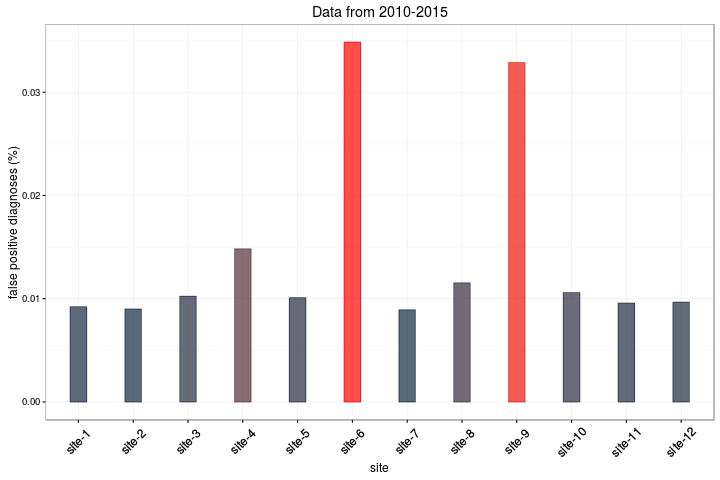
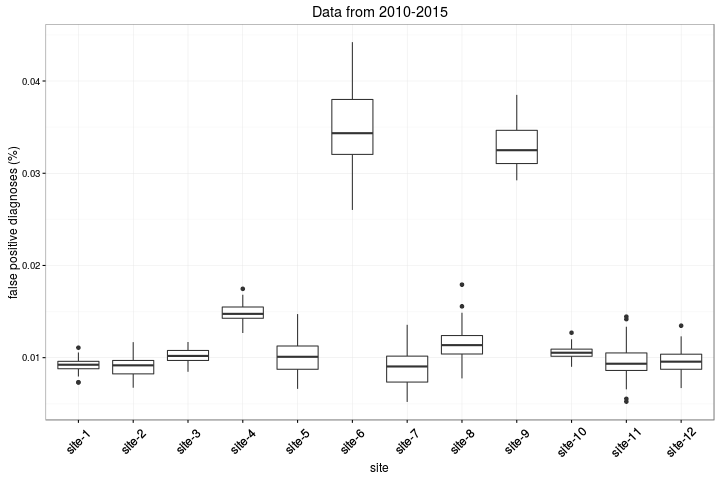
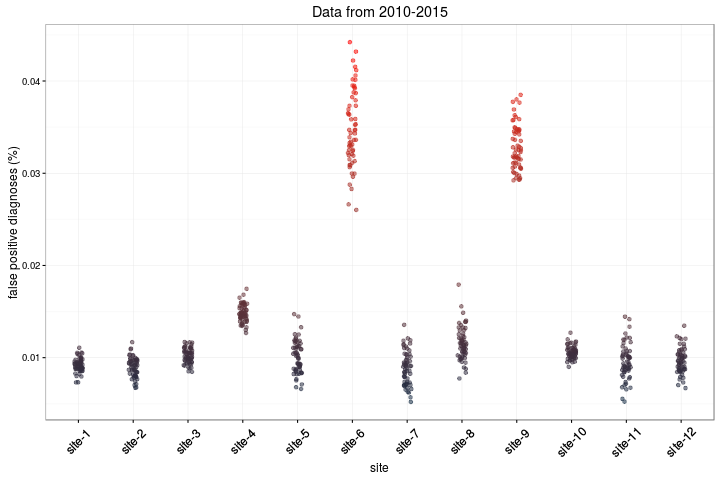
Example: Assessing the plausiblity of false positive diagnoses rates within a set of observation sites. These visualizations demonstrate how anomalously high rates can be detected and flagges. The data can be examined at increasing levels of detail depending on user needs.
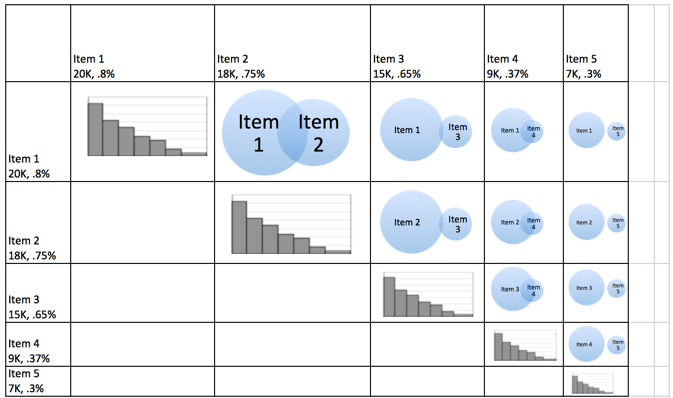
Event Co-occurrence Explorer Mockup
Idea for a complex, interactive visualization for exploring the frequency of specific event types across patients and the proportion of patients experiencing any given pair of events.