DQA visualizations: Fidelity
Fidelity: Are data values dependable? Do they conform to formatting standards, allowed values standards, repeated measures, and results of computed values? Focuses on conformance, coherence, or agreement of data values.
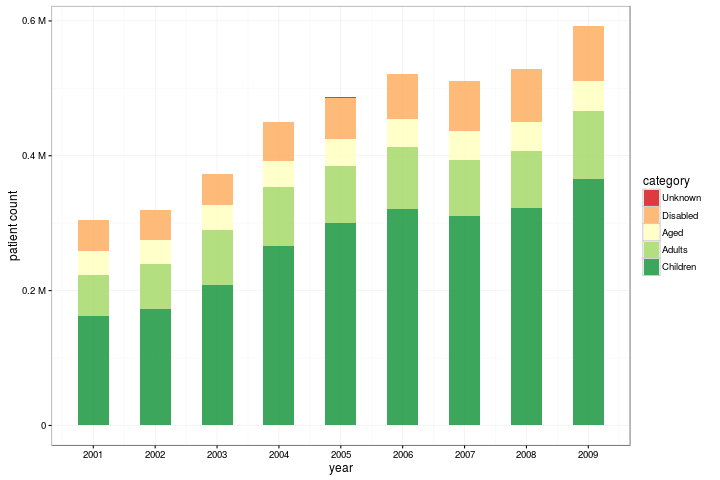
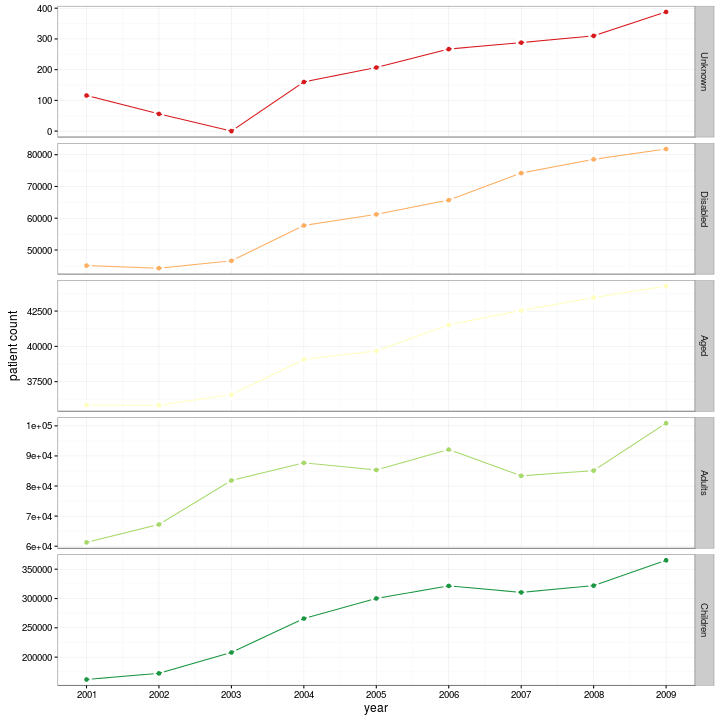
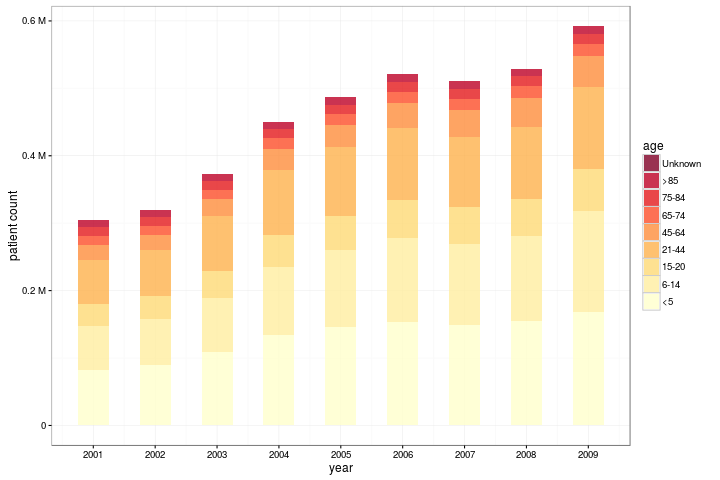
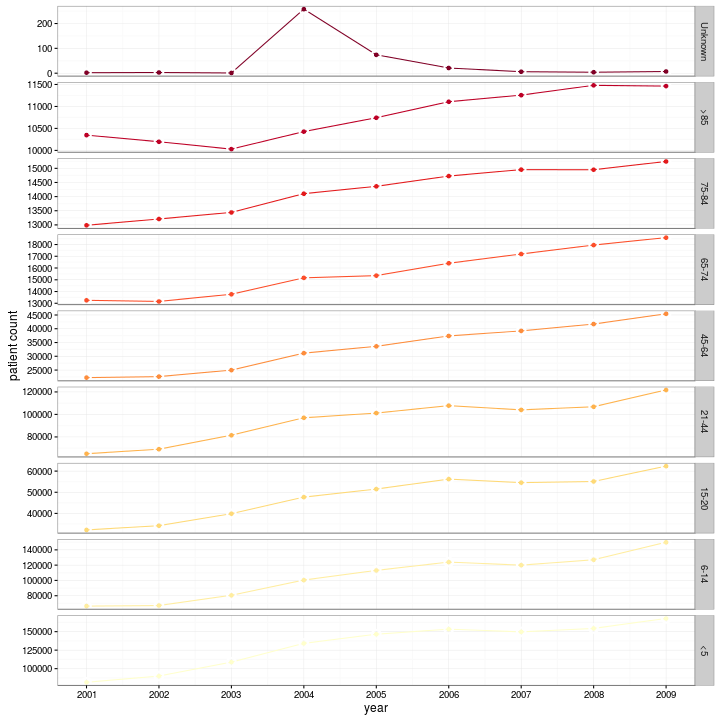
Visualizing fidelity in CO medicaid data
These plots visualize the distribution of medicaid patients in different age groups and beneficiary categories. These visualizations can be used to assess whether the data conform to expected demographic distributions in the state, and to check for any anomalous spikes or dips in patient counts in any of the groups. For example, note the trends in patients classified as "Unknown".
Click here for more details about these data.