DQA visualizations: Completeness
Completeness: Are data values present in the amount that is expected? May be assessed by looking at counts over time or counts by non-temporal units such as counts by patients, by diagnoses, or by encounters.
Visualizing completeness
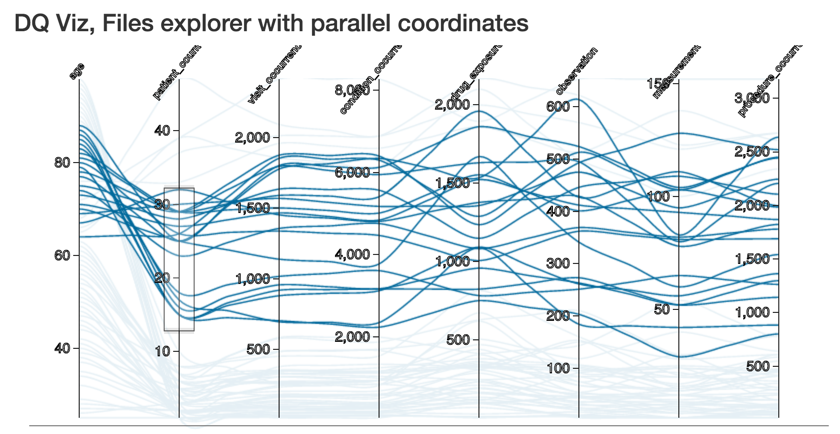
Parallel coordinates is a visualization technique for
multivariate data. Each axis represents event counts of
data in a particular domain or database table. Each curve
in this image represents all patients of a specific age.
Click here for interactive parallel coordinates viz.